There has been occasional discussion in the TEI community for years about what member institutions actually want out of the TEI Consortium, with particular concern that libraries have been the main funders of the TEI but are failing to renew their membership. (The TEI Consortium offers various levels of membership, expecting larger, wealthier institutions to join at a higher level. It has often been asserted that libraries are overrepresented among the higher-paying membership levels.) The evidence for the drop in support by libraries has been anecdotal, and speculation for why this has generally pointed to two things: that libraries are under pressure to cut their budgets, or that they no longer see value in the work of the TEI Consortium.
In order to move beyond anecdotes, my colleague Michelle Dalmau (Indiana University) and I undertook a survey in late 2012 and early 2013 of attitudes toward the TEI among those who work in libraries. We presented our findings at the 2013 TEI conference. The study was conducted in compliance with the Institutional Review Board on the IU Bloomington campus, and we have not yet confirmed that we can release the data to the public. But, and our slides and our data are now available online, as is an article on this work published in the Journal of the Text Encoding Initiative.
Most of the overview data in our slides comes from our survey, except for slide 11, which I reproduce below:
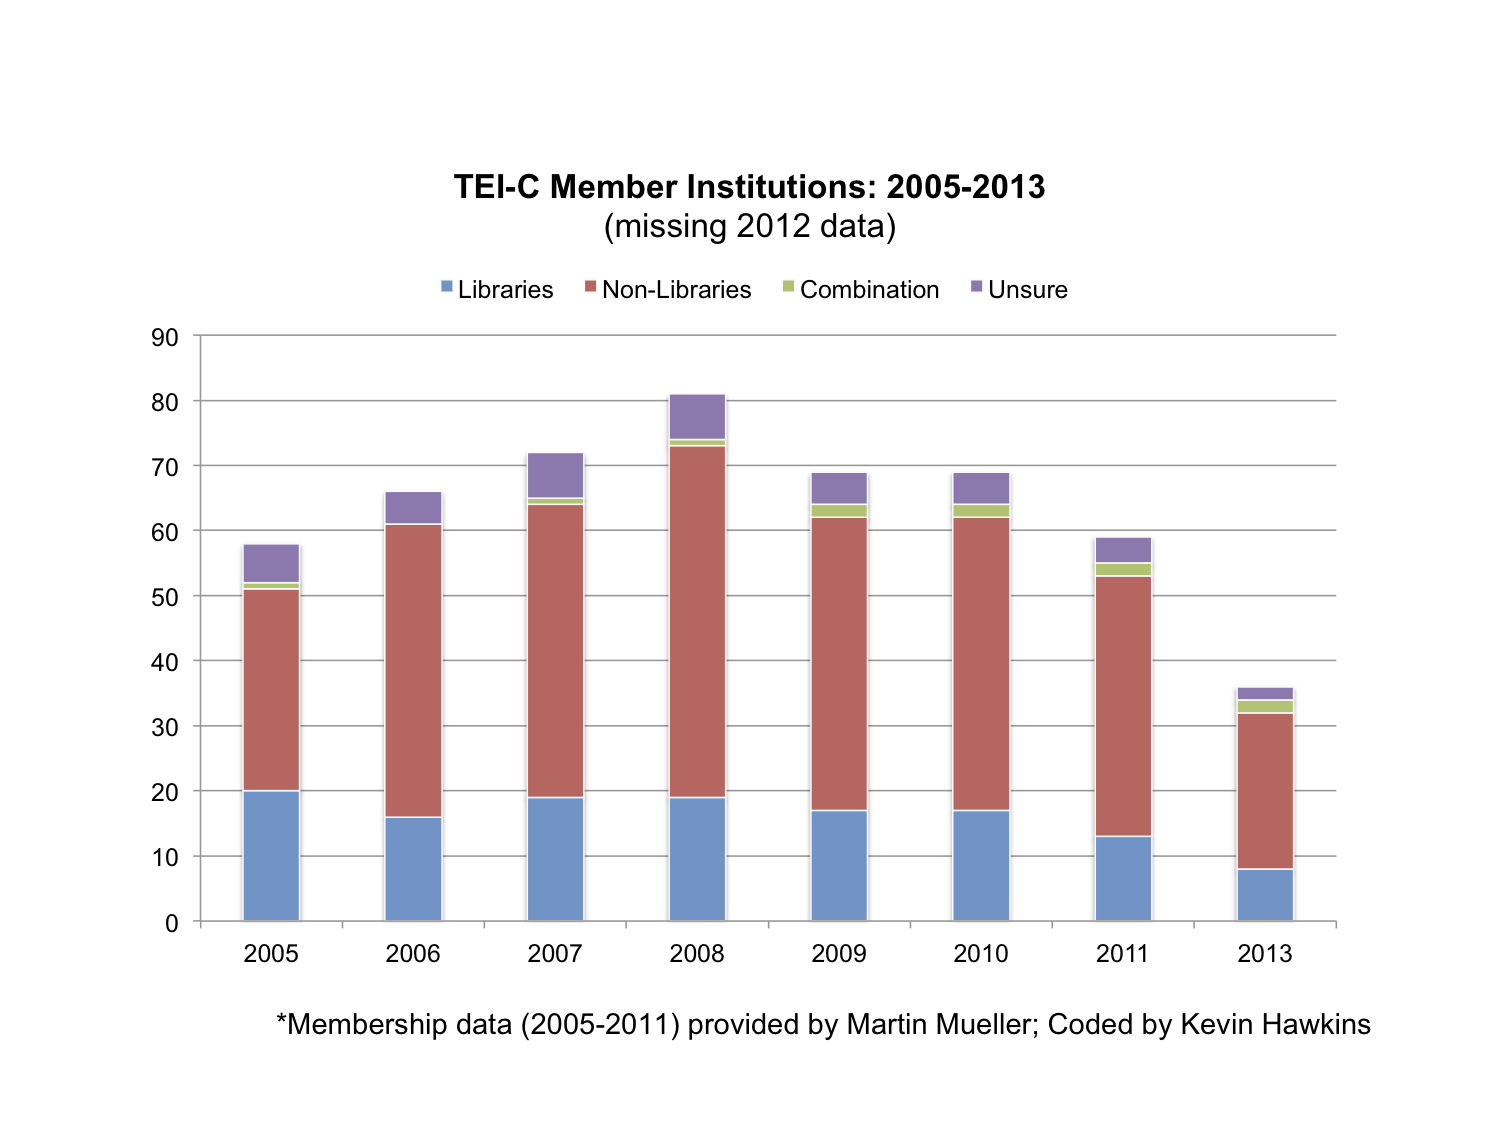
Martin Mueller, a former Chair of the Board of Directors of the TEI Consortium, provided us with data on TEI members for 2005 to 2011, including how much each institution paid. I supplemented this in September 2013 with data from the TEI website showing current members, assuming that each listed there had in fact paid for the year. I coded each member institution by type of library (or not a library at all), noting border cases such as archives, digital humanities centers co-funded by a library, and uncertain cases.
The graph in our slides shows only the number of institutions, not how much each spends on membership. Since we neglected to include a slide showing the portion of membership (in dollars) paid by libraries, I’ve adjusted my coding to correct a few errors and to count borderline and uncertain cases as half-funded by libraries and run the numbers. When counting how much is spent, we get the following:
| Year | Total revenue from TEI member institutions | Portion of this from libraries | % from libraries |
|---|---|---|---|
| 2005 | $101,855.73 | $54,090.00 | 53% |
| 2006 | $94,409.07 | $39,077.00 | 41% |
| 2007 | $108,237.24 | $51,282.00 | 47% |
| 2008 | $112,913.09 | $48,757.00 | 43% |
| 2009 | $94,519.50 | $38,202.00 | 40% |
| 2010 | $92,071.24 | $45,814.00 | 50% |
| 2011 | $58,873.72 | $27,614.00 | 47% |
| 2012 | |||
| 2013 | $75,250.00 | $27,000.00 | 36% |
As you can see, the portion of TEI revenue coming from libraries fluctuated between 40% and 50% between 2005 and 2011. Looking at the data, I can say that the jump from 2009 to 2010 is mostly due to Brown University reorganizing its Scholarly Technology Group into the Brown University Library. There has been a significant drop between 2011 and 2013, though this time, with a drop in support by libraries of only $614, it’s due to an increase in support from members that are not libraries.

This work by Kevin Hawkins is licensed under a Creative Commons Attribution-NonCommercial 4.0 International